@
目录
- 1. pyqtgraph 如果setLogMode为true 显示的是科学计数
- 2. pyqtgraph中AxisItem.py 生成log坐标字符串处理方法
- 3. 通过重写AxisItem类中的logTickStrings方法来修改坐标轴显示的数值
- 4. TestCode
- 5. 参考文档
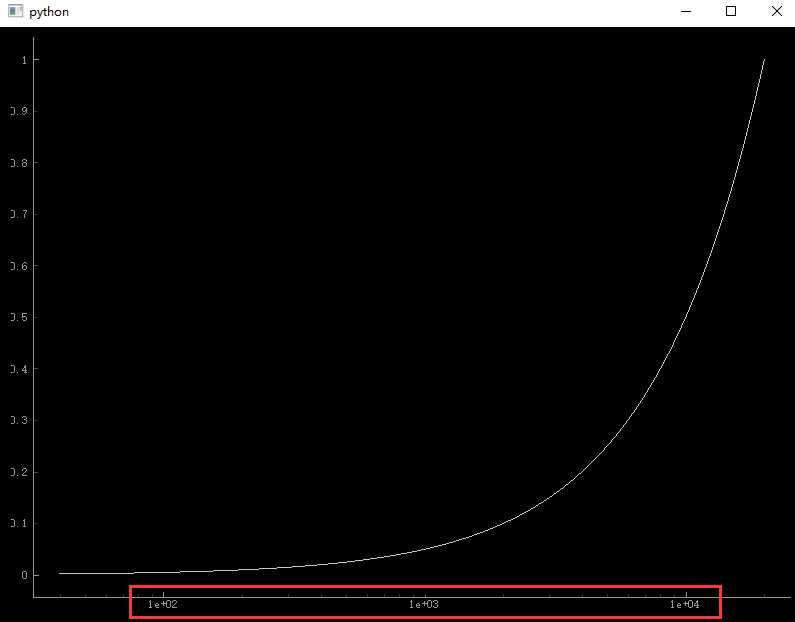
1. pyqtgraph 如果setLogMode为true 显示的是科学计数
有的时候我们并不想显示科学计数,不直观。
如果数值不是特别大,还是直接显示数值比较直观。

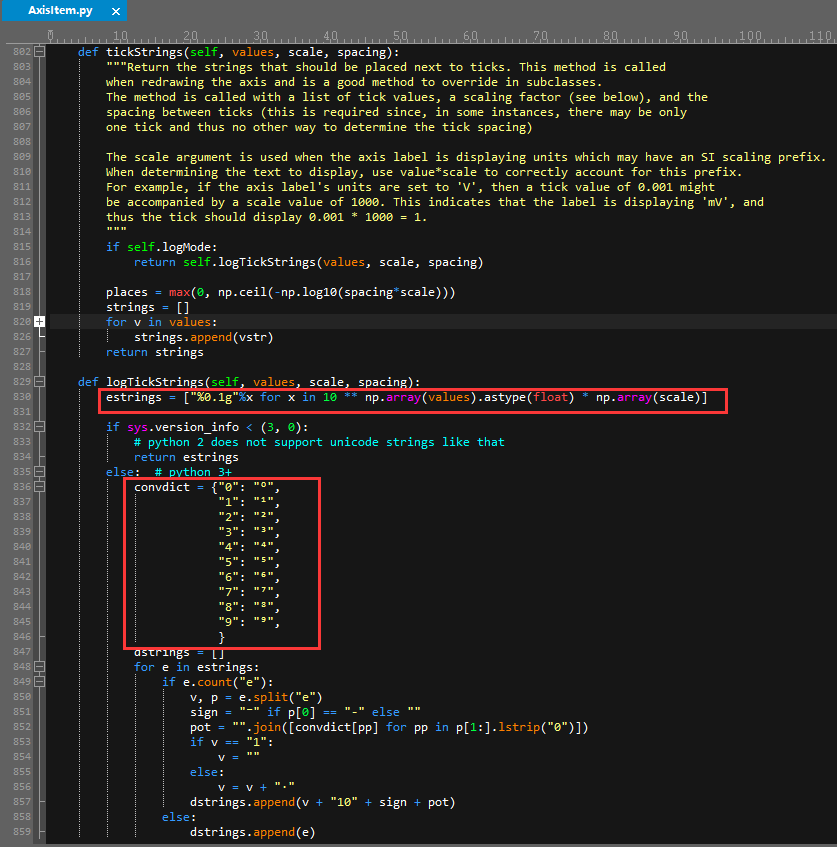
2. pyqtgraph中AxisItem.py 生成log坐标字符串处理方法

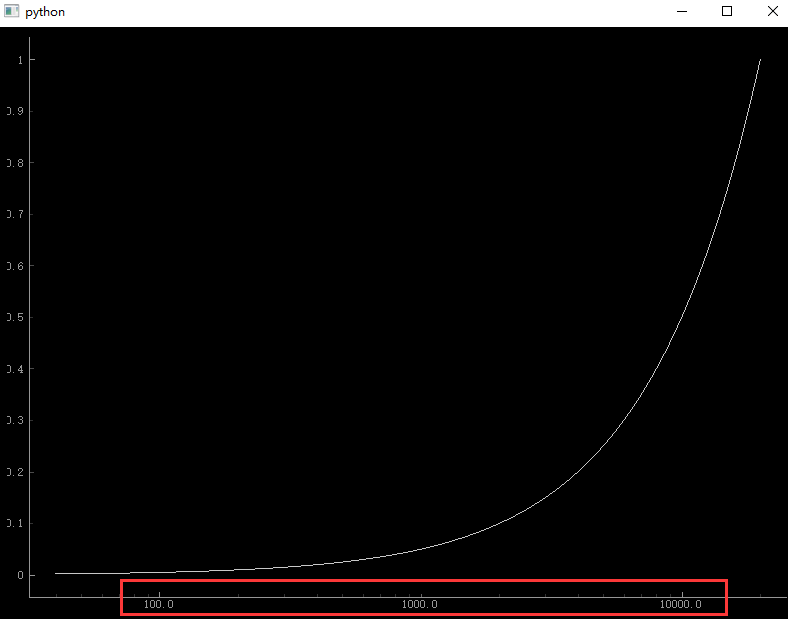
3. 通过重写AxisItem类中的logTickStrings方法来修改坐标轴显示的数值

4. TestCode
import numpy as np
import pyqtgraph as pg


class LogStringAxis(pg.AxisItem):
    def logTickStrings(self, values, scale, spacing):
        estrings = [\"%0.1f\" % x for x in 10**np.array(values).astype(float)]
        return estrings


win = pg.GraphicsWindow()
logStringAxis = LogStringAxis(orientation=\'bottom\')
plot = win.addPlot(axisItems={\'bottom\': logStringAxis})
plot.setLogMode(True, False)
x1 = np.linspace(0, 20000, 500)
y1 = np.linspace(0, 1, 500)
curve = plot.plot(x1, y1)

if __name__ == \'__main__\':
    import sys
    if sys.flags.interactive != 1 or not hasattr(QtCore, \'PYQT_VERSION\'):
        pg.QtGui.QApplication.exec_()
5. 参考文档
- 关于python:在matplotlib.pyplot中防止科学计数法
- Show string values on x-axis in pyqtgraph
来源:https://www.cnblogs.com/dreamblog/p/15956947.html
本站部分图文来源于网络,如有侵权请联系删除。
 百木园
百木园