✨蒙特卡罗方法
蒙特·卡罗方法(Monte Carlo method),也称统计模拟方法,是二十世纪四十年代中期由于科学技术的发展和电子计算机的发明,而被提出的一种以概率统计理论为指导的一类非常重要的数值计算方法。是指使用随机数(或更常见的伪随机数)来解决很多计算问题的方法。
蒙特卡罗方法是一种计算方法。原理是通过大量随机样本,去了解一个系统,进而得到所要计算的值。
它非常强大和灵活,又相当简单易懂,很容易实现。对于许多问题来说,它往往是最简单的计算方法,有时甚至是唯一可行的方法。
它诞生于上个世纪40年代美国的\"曼哈顿计划\",名字来源于赌城蒙特卡罗,象征概率。
✨蒙特卡罗计算π
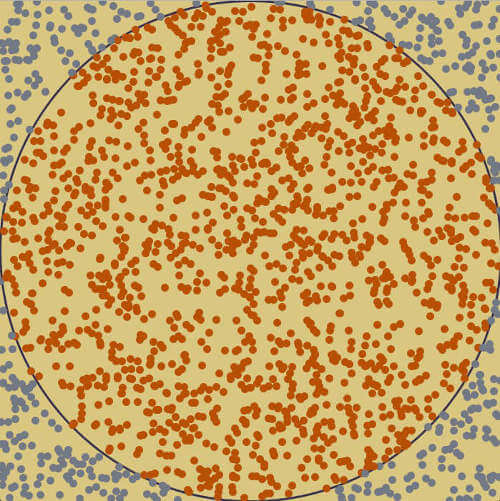
正方形内部有一个相切的圆,它们的面积之比是π/4。


现在,在这个正方形内部,随机产生10000个点(即10000个坐标对 (x, y)),计算它们与中心点的距离,从而判断是否落在圆的内部。

如果这些点均匀分布,那么圆内的点应该占到所有点的 π/4,因此将这个比值乘以4,就是π的值。通过 R语言脚本 随机模拟30000个点,π的估算值与真实值相差0.07%。
# estimating pi using Monte Carlo methods. This code won\'t run perfectly for you, because I
# didn\'t save everything I did, like adding vectors to a dataframe named Pi.
# Just the important stuff is here.
center <- c(2.5, 2.5) # the center of the circle
radius <- 2.5
distanceFromCenter <- function(a) {
sqrt(sum((center - a) ^ 2))
}
# let\'s define a 5 by 5 square matrix
points <- c(0,0, 0,5, 5,5, 5,0)
square <- matrix(points, nrow = 4, ncol = 2, byrow = TRUE)
# now all I need to do is make matrix A a matrix of real simulated points.
n <- 100 # number of points
A <- matrix(runif(n*2, min=0, max=5), nrow = n, ncol = 2, byrow = T) # random sampling occurs here!!!
## An alternate way to generate randoms, with faster convergence
# library(randtoolbox)
# A <- matrix(5*halton(n*2), nrow = n, ncol = 2, byrow = T)
# here\'s how you\'ll test if it\'s in the circle.
b <- apply(A, 1, distanceFromCenter)
# d <- subset(b, b < radius) # if you know a better way to do this part, email me.
# num <- length(d) / length(b)
num <- mean(b < radius)
piVec <- c()
for (i in 1:2000) {
n <- i
A <- matrix(runif(n*2, min=0, max=5), nrow = n, ncol = 2, byrow = T)
b <- apply(A, 1, distanceFromCenter)
d <- subset(b, b < radius)
num <- length(d) / length(b)
piVec[i] = num*4
}
library(data.table)
Pi <- data.frame(piVec)
Pi <- data.table(Pi)
Pi[, ind := seq(0, 1999)]
Pi[, error := abs(pi - piVec)]
Pi <- data.frame(Pi)
names(Pi) <- c(\"guess\", \"ind\", \"error\")
##### Graphing the error
# note - if you want this part to work for you, you\'ll have to create the appropriate data frame from the piVec vector.
library(ggplot2)
ggplot(Pi, aes(x = ind, y = error)) +
geom_line(colour = \'#388E8E\') +
ggtitle(\"Error\") +
xlab(\"Sample Size\") +
ylab(\"Error\")
✨代码实现
Loop实现
import random
import time
# 投掷点数总和
DARTS = 1000 * 1000
# 落在圆内的点数
hits = 0
# 开始计时
start = time.perf_counter()
for i in range(1, DARTS + 1):
x, y = random.random(), random.random()
dist = pow(x ** 2 + y ** 2, 0.5)
if dist <= 1.0:
hits = hits + 1
else:
pass
# 计算PI
pi = 4 * (hits / DARTS)
# 结束计时
end = time.perf_counter()
print(\"圆周率: {}\".format(pi))
print(\"使用循环计算耗时: {:.5f}s\".format(end - start))
Numpy性能优化
import random
import time
import numpy as np
def calPIbyLoop():
# 投掷点数总和
DARTS = 1000 * 1000
# 落在圆内的点数
hits = 0
# 开始计时
start = time.perf_counter()
for i in range(1, DARTS + 1):
x, y = random.random(), random.random()
dist = pow(x ** 2 + y ** 2, 0.5)
if dist <= 1.0:
hits = hits + 1
else:
pass
# 计算PI
pi = 4 * (hits / DARTS)
# 结束计时
end = time.perf_counter()
print(\"圆周率: {}\".format(pi))
print(\"使用循环计算耗时: {:.5f}s\".format(end - start))
def calPIbyNumpy():
# 投掷点数总和
DARTS = 1000 * 1000
# 落在圆内的点数
hits = 0
# 开始计时
start = time.perf_counter()
# 使用numpy的随机函数生成2行DART列的矩阵: points, 代表投掷DART次点的坐标,
# 第0行代表x轴坐标,第1行代表y轴坐标。
points = np.random.rand(2, DARTS)
# print(points)
# 矩阵运算代替循环
# numpy.where(condition[, x, y])
# Return elements chosen from x or y depending on condition.
hits = np.sum(np.where(((points[0] ** 2 + points[1] ** 2) ** 0.5) < 1, 1, 0))
# 计算PI
pi = 4 * (hits / DARTS)
# 结束计时
end = time.perf_counter()
print(\"圆周率: {}\".format(pi))
print(\"使用Numpy计算耗时: {:.5f}s\".format(end - start))
if __name__ == \"__main__\":
calPIbyLoop()
calPIbyNumpy()
✨分析对比
使用numpy实现相比传统运算方法可以获得极大的性能优化
当总共投掷点数总和为100 0000
通过对比已经可以发现性能提升

当总共投掷点数总和为1000 0000
通过对比可以发现显著的性能提升!

✨参考及引用
https://baike.baidu.com/item/蒙特·卡罗方法/8664362
http://www.ruanyifeng.com/blog/2015/07/monte-carlo-method.html
https://github.com/alexhwoods/alexhwoods.com/blob/master/Machine Learning/Monte Carlo/EstimatingPi.R
https://www.jianshu.com/p/07527fd43628
https://numpy.org/doc/stable/reference/generated/numpy.where.html
⭐转载请注明出处
本文作者:双份浓缩馥芮白
原文链接:https://www.cnblogs.com/Flat-White/p/14807002.html
版权所有,如需转载请注明出处。
来源:https://www.cnblogs.com/Flat-White/p/14807002.html
图文来源于网络,如有侵权请联系删除。
 百木园
百木园